
INP in your online store: measuring, understanding and optimising responsiveness in Shopware 6 and Shopify
A customer selects the colour brown on a product page. Nothing happens. They tap again. Half a second later the image changes, the price updates, and because they tapped twice, black is now selected again. That half second isn’t a loading problem. The page loaded long ago. It simply didn’t respond.
That is exactly what Interaction to Next Paint, INP for short, measures. Since 12 March 2024, it has been one of Google’s Core Web Vitals, replacing the old First Input Delay metric. This article goes deep: what exactly INP measures, why lab values are often misleading for INP, how to find the slowest element in your store and how Shopware 6 and Shopify stores reach top values.
The key points:
INP measures responsiveness, not loading. A store can load in two seconds and still react sluggishly.
A value of up to 200 milliseconds is good, measured on real visits, specifically on the slowest 25 percent.
Lighthouse doesn’t measure INP by default. If you only check lab values, you won’t see the problem.
The biggest drag in a store is rarely the store itself, but third-party scripts: consent banners, tracking, chat, reviews.
A fast server helps loading but hardly helps INP. INP happens in the customer’s browser.
What exactly INP measures
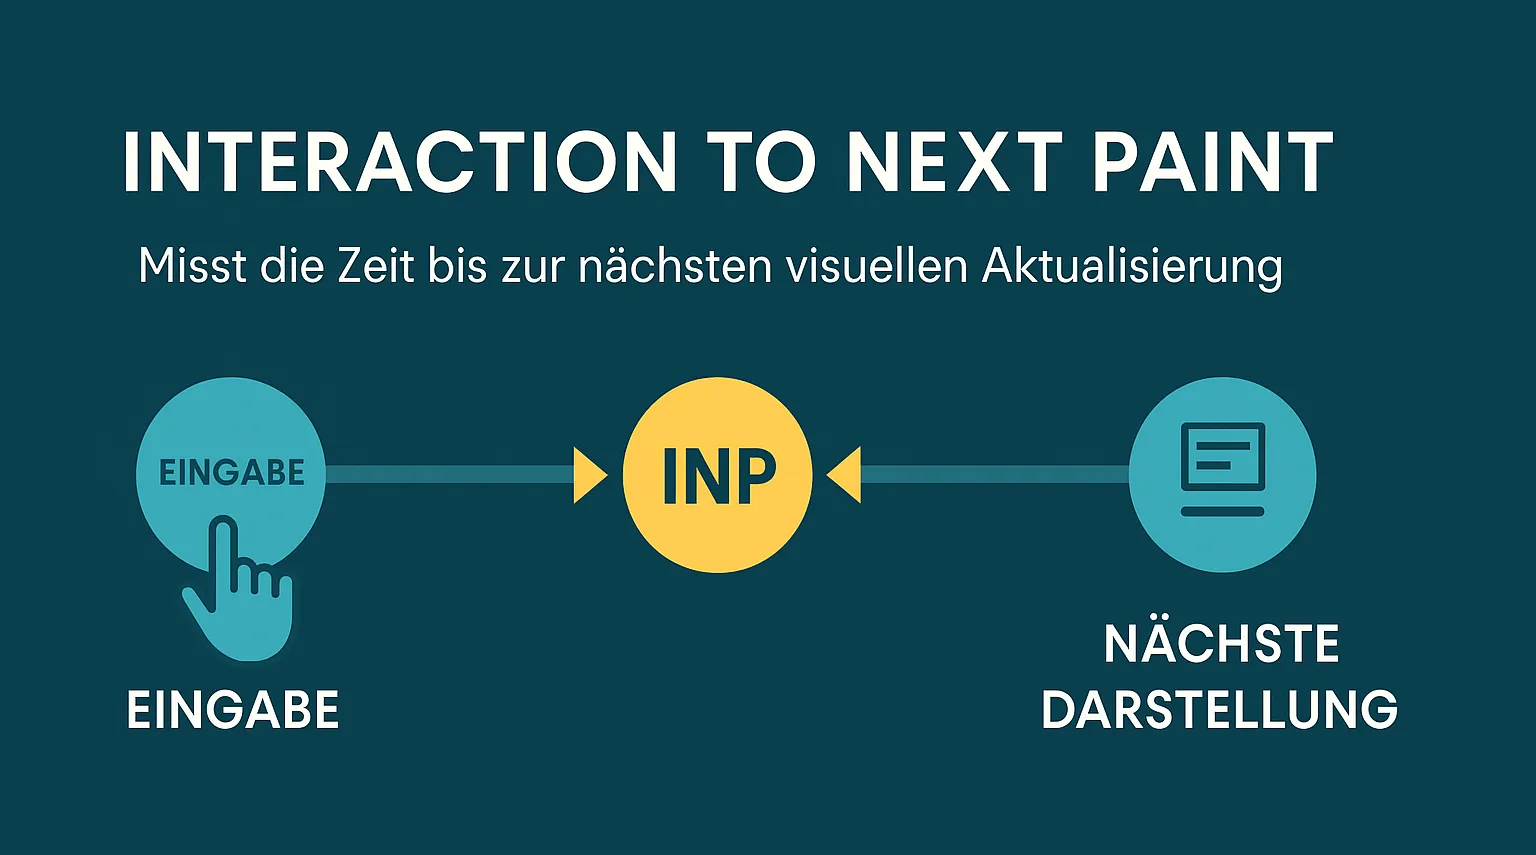
Every interaction on a page, every click, tap and key press, goes through three phases before the customer sees a response:
Input delay: the time until the browser can even begin processing the input. If it is busy with other JavaScript, the input has to wait.
Processing: the time taken by the code that responds to the input, such as the script that switches a variant or adds a product to the cart.
Presentation: the time until the browser has calculated the change and drawn it on the screen.
The sum of these three phases is the latency of an interaction. A page’s INP is essentially the slowest interaction of a visit. For pages with very many interactions, Google ignores the highest outlier for every 50 interactions, so that a single extreme value doesn’t distort the picture. Scrolling and merely hovering with the mouse don’t count.
The difference from the old First Input Delay is decisive. FID only measured the waiting time of the very first input, not how long processing took, nor what happened afterwards. Most stores therefore had good FID values even though filters, variant selection and the cart were sluggish. INP looks at the whole visit and uncovers exactly these spots.
The thresholds
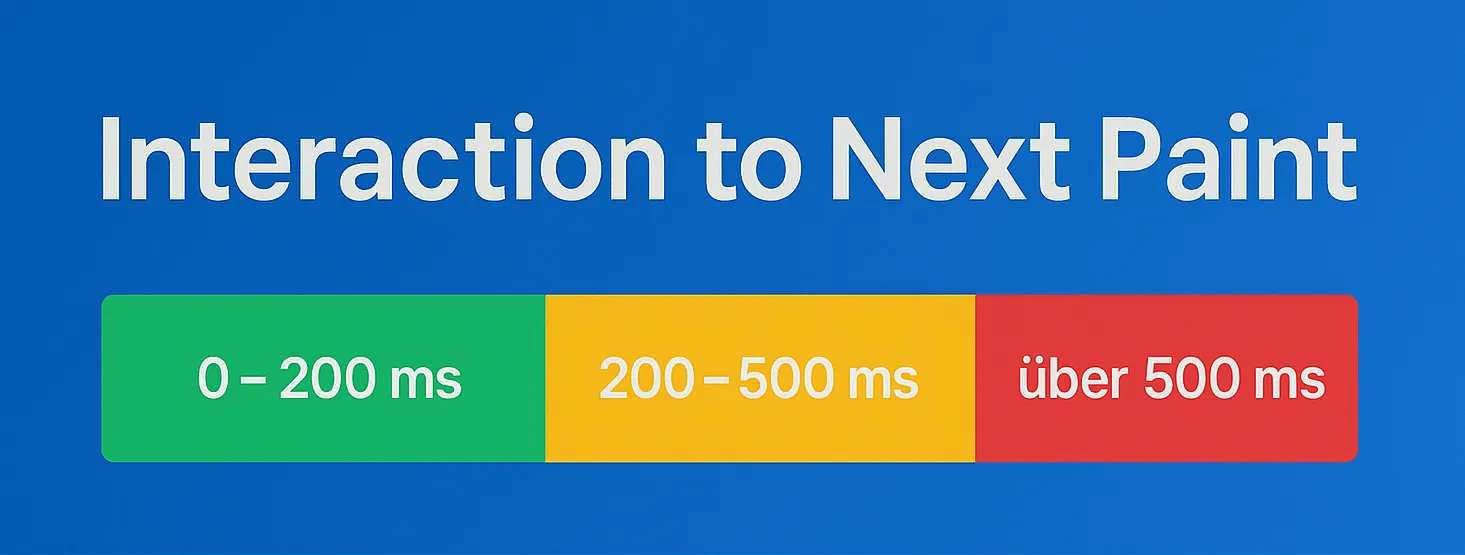
Google rates INP in three levels:
Rating | INP |
Good | up to 200 ms |
Needs improvement | over 200 to 500 ms |
Poor | over 500 ms |
What counts is not the average, but the 75th percentile of all page views, separately for smartphone and desktop. A store only passes if the slower visits also stay below 200 milliseconds. Because smartphones have considerably less computing power, the mobile value is almost always the critical one. If you want headroom, aim for 100 to 150 milliseconds on mobile.
Why INP matters so much for stores
INP is part of the signals Google uses to assess user experience. Its direct influence on ranking is limited: with equally good content it can tip the balance, but it won’t turn a weak store into a leader. Its influence on revenue is more important.
An online store is one of the most interactive types of website there is. Customers filter, choose sizes and colours, browse images, add products to the cart and fill in forms. Each of these actions is an interaction. If it responds too slowly, customers tap twice, lose trust or abandon. This shows up in the conversion rate long before it becomes visible in rankings.
Lab and field: why Lighthouse can mislead you
There are two kinds of measurements, and for INP the difference is particularly large.
Lab data is produced in a simulated environment, for example with Lighthouse or in the lower part of PageSpeed Insights. Lighthouse loads the page once and doesn’t click anywhere. In this default mode, it therefore can’t measure INP at all. Instead, it shows Total Blocking Time, i.e. how long the browser is blocked while loading. That is a hint, but it isn’t INP.
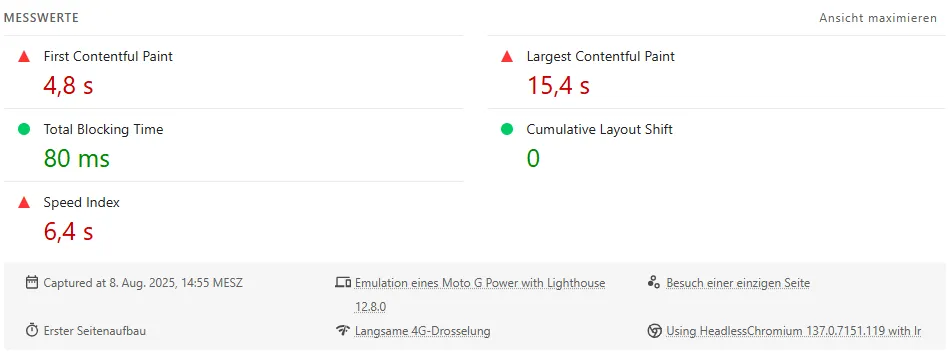
Lab data from Lighthouse: instead of INP, only Total Blocking Time appears. That it is green at 80 ms says little about how quickly filters or the cart respond later.
Field data comes from real visitors with real devices. Google collects it in the Chrome User Experience Report, and PageSpeed Insights shows it in the upper part under “Discover what your real users are experiencing”. Only here is there a real INP value. The data covers the past 28 days. If a single page has too few visits, Google shows the value for the whole domain.
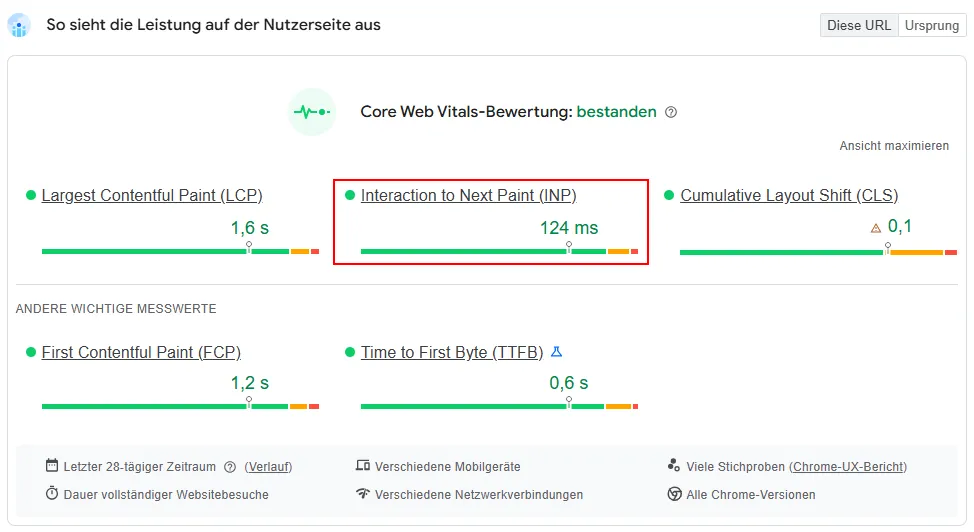
Field data in PageSpeed Insights: this is where the real INP value from the last 28 days appears, measured on real visits.
This leads to the first rule: always assess INP using field data. And the second: because field data rolls over 28 days, you only see the full effect of an improvement after weeks. If you want to know sooner whether a change works, you need your own measurements.
How to measure and check INP yourself
Google Search Console: The Core Web Vitals report groups similar pages and shows which groups are poor or need improvement for INP. In stores, these are almost always page types: category pages, product pages, cart. This is the starting point.
PageSpeed Insights: For a single URL, it shows the field data for the page and the domain. Check one typical category page and one product page.
Shopify admin: Shopify shows the Core Web Vitals of real visits directly in the admin in its web performance report, including INP and its history. For Shopify merchants, this is the fastest overview.
Chrome DevTools: In the Performance panel, the live metrics show the INP of every interaction while you click yourself. Set CPU throttling to four to six times to simulate an average smartphone. Then click through filters, variants and the cart and immediately see which action is above 200 ms.
Measuring real visits with attribution: Google’s free web-vitals JavaScript library measures INP for every visitor and, with its attribution feature, reveals which element triggered the slowest interaction and which of the three phases took too long. This data can be sent to Google Analytics via Google Tag Manager, for example.
The last point is the one hardly any store uses, and it is the most effective. Instead of guessing, you see in black and white that, for example, the “Add to cart” button on product pages is at 480 ms on mobile, with 300 ms of that spent on processing. In simplified form, the measurement looks like this:
import { onINP } from 'web-vitals/attribution'; onINP(({ value, attribution }) => { // value: INP in milliseconds // attribution.interactionTarget: triggering element, e.g. "button.btn-buy" // attribution.inputDelay, processingDuration, presentationDelay: // how much each of the three phases contributed sendToAnalytics(value, attribution);});
If the input delay is long, the browser was busy with something else, usually third-party scripts. If processing is long, the code behind the button is too heavy. If presentation is long, the browser has to recalculate too much at once, often because the page is too large.
The typical INP brakes in an online store

The click on “Accept all”: For many visitors, the first interaction is the consent banner. On many stores, this click launches analytics, advertising pixels, remarketing and other tags all at once. The browser is then blocked for hundreds of milliseconds. In the attribution data, the consent button of all things turns up as the slowest interaction.
Third-party scripts: Chat windows, review widgets, recommendation engines, heatmaps and testing tools attach themselves to clicks and inputs and run on the same main thread as the store. Each one on its own is harmless; together they slow down every interaction.
Variant selection: When switching colour or size, price, availability, images and often the entire buy box are reloaded and rebuilt.
Filters in categories: Every filter change reloads the product list. For large lists with many images and product tiles, presentation becomes the bottleneck.
Add to cart: The click opens an off-canvas cart, loads its contents and at the same time triggers several tracking events.
Large menus: Mega menus with hundreds of categories bloat the page. The more elements a page has, the longer every recalculation takes.
Search while typing: Suggestions that are reloaded and redrawn immediately on every keystroke.
Shopware 6: where it sticks and what helps
In Shopware 6, the storefront bundles the JavaScript of the theme and all plugins. Every plugin with its own storefront logic enlarges these bundles and registers its own responses to clicks. The most common causes of poor values are therefore plugins that are switched on but no longer needed, third-party scripts built directly into the theme, and custom extensions that recalculate too much on every interaction.
In concrete terms, these help in Shopware 6:
Plugin inventory: Check every plugin with storefront JavaScript for its benefit. Whatever isn’t needed is uninstalled, not just deactivated, and the theme is then recompiled.
Lighten variant switching: Give immediately visible feedback, such as marking the selected variant and showing a loading state, before price and images are reloaded.
Design filters deliberately: On smartphones, a filter that only loads on “Apply” is often faster than one that reloads the whole list with every tick.
Off-canvas cart: Keep the content lean and trigger tracking events so that they only run after painting.
Protect the main thread: Move tracking tags out via server-side tracking instead of running them all in the browser.
A common misconception: HTTP cache, reverse proxy and a fast server improve loading time, but they change little about INP. INP happens in the customer’s browser, not on the server. More on the technical foundations under Shopware SEO.
If you still run a Shopware 5 store, things are considerably harder. The old storefront is based on jQuery and many synchronously loaded plugins, and optimisation quickly reaches its limits. As Shopware 5 no longer receives updates, switching is usually the better investment. The options are shown on the page about migrating from Shopware 5.
Shopify: where it sticks and what helps
Shopify stores start with an advantage: modern Online Store 2.0 themes are lean out of the box. The problems usually arise afterwards, through apps.
App scripts: Almost every app for reviews, upselling, wishlists, chat or pop-ups brings its own JavaScript that runs on every page. Ten apps mean ten scripts competing for the same main thread.
Leftovers from uninstalled apps: When an app is removed, its code often stays in the theme and keeps loading. Checking the theme for such leftovers often brings quick improvements.
App embeds: Many apps are activated as app embeds in the theme editor. Whatever is switched on there but isn’t needed should be turned off.
Variants and cart: Many themes reload entire sections of the page when switching variants or adding to the cart. The larger these sections, the longer the presentation.
Older or heavily customised themes: Themes with jQuery and many effects are considerably heavier than current themes.
The web performance report in the Shopify admin shows whether INP improves after a change. More on the platform’s peculiarities under Shopify SEO.
How to bring INP to top values
Regardless of the store system, the same principles apply. For developers they are craft; for marketers they are worth knowing, because they explain why another tracking tag isn’t free.
Respond first, then work: The most important principle. The visible response to a click comes immediately, the heavy work afterwards. The button shows “adding…” before the cart is loaded and tracking is triggered.
Break up long tasks: The browser can only do one thing at a time. Anything that takes longer than 50 ms counts as a long task and blocks input. Breaking large tasks into small steps and giving the browser room in between keeps the page responsive.
Defer non-urgent work: Tracking events, analytics and recommendations don’t need to run at the very moment the customer clicks.
Less JavaScript: Every script that isn’t loaded can’t slow anything down. The Coverage tab in Chrome DevTools shows how much of the loaded code is actually used.
Load third parties only when needed: A chat doesn’t need to start when the page loads, only when someone taps the chat icon.
Keep the page lean: Fewer elements mean faster recalculations. Content outside the visible area can be marked via CSS so that the browser only calculates it when needed.
Bundle inputs: Search doesn’t react to every single keystroke, but shortly after the customer has stopped typing.
This simplified example shows what the first principle looks like in code:
button.addEventListener('click', async () => { button.classList.add('is-loading'); // 1. immediately visible feedback await scheduler.yield(); // 2. let the browser paint first await addToCart(); // 3. then the actual work pushTrackingEvent(); // 4. tracking at the very end});
scheduler.yield() is supported by Chromium-based browsers. For other browsers, there are simple fallbacks, for example via setTimeout.
A roadmap in five steps
Step 1, record the status quo: Search Console and PageSpeed Insights show which page types have the problem; Shopify merchants can also see it in the admin.
Step 2, find the cause: By measuring real visits with attribution, you see which element and which phase cause the problem.
Step 3, reproduce: In Chrome DevTools, with throttled CPU, repeat the affected interaction and see in the performance profile which script is blocking.
Step 4, fix: First the big levers, i.e. the consent click, third parties and unnecessary plugins or apps, then the fine-tuning of variants, filters and cart.
Step 5, confirm: Your own measurement shows the effect after days, Google’s field data after about four weeks. Then keep monitoring the value, because every new app, plugin and tag can make it worse again.
INP optimisation for your store
INP is one of the topics where technology and marketing meet directly: every additional tracking tag, every app and every widget has a price, and it is paid in milliseconds. arboro measures INP on real visits, traces the causes down to the individual element and fixes them directly in your Shopware 6 or Shopify store. More on this under Shopware and Shopify support and server-side tracking.
Image source: @StockWorld – stock.adobe.com
Author

Zoran Artmagic
Managing Director
In 2009, he started arboro in a tiny office in Heilbronn, and now it’s a thriving e-commerce and online marketing agency with multiple locations. Zoran worked freelancing as a software architect for big companies before making arboro his masterpiece. He values a good work atmosphere, equal communication, and customer focus. Nowadays, he's all about advising clients and finding talented staff for the ever-growing company. Plus, he's super passionate about evolving arboro's mission and company values.