
Google PageSpeed Insights
 Reviewed by Zoran Artmagic ·

Google PageSpeed Insights is a free tool from Google that measures how quickly a page loads and how well it can be used, on smartphone and on desktop. It combines two completely different kinds of measurements: real data from visitors and a simulated measurement in the lab. Anyone who knows this difference reads PageSpeed Insights correctly. Anyone who doesn’t often chases a score that plays hardly any role for Google or customers.
The tool is available at pagespeed.web.dev. You enter a URL and receive the result within a few seconds.
Field data: what real visitors experience
The upper part of the report is called “Discover what your real users are experiencing”. It contains measurements from the Chrome User Experience Report, i.e. from real visitors with real devices and connections:
Period: the past 28 days, continuously updated.
Benchmark: the 75th percentile. A value counts as good if at least three quarters of page views achieve it.
Page or domain: if a single URL has too few visits, the tool shows the values for the whole domain.
Core Web Vitals: the “passed” or “failed” assessment refers to the three core metrics.
Only this field data feeds into Google’s assessment of user experience.
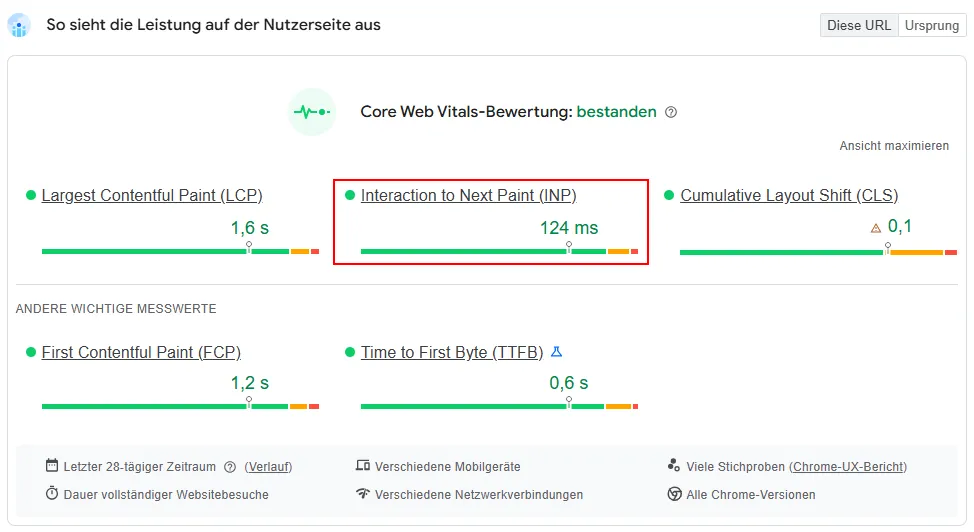
Field data in PageSpeed Insights: real measurements from the last 28 days with the Core Web Vitals assessment (German interface).
The Core Web Vitals
Metric | What it measures | Good | Poor |
Largest Contentful Paint (LCP) | when the largest visible element has loaded, in stores usually the product or hero image | up to 2.5 s | over 4 s |
Interaction to Next Paint (INP) | how quickly the page responds to clicks and inputs | up to 200 ms | over 500 ms |
Cumulative Layout Shift (CLS) | how much content shifts while loading | up to 0.1 | over 0.25 |
The report also shows two supplementary values: First Contentful Paint, when anything appears at all, and Time to First Byte, how quickly the server responds. How responsiveness is measured and improved is explained in detail in the article on INP.
Lab data: the simulated measurement
The lower part of the report comes from Lighthouse. Here the page is loaded once in a simulated environment, on smartphone with a throttled mid-range device and a slow mobile connection. This produces the familiar score from 0 to 100:
90 to 100: good
50 to 89: needs improvement
0 to 49: poor
The score is made up of several lab measurements, including Largest Contentful Paint, Total Blocking Time and Cumulative Layout Shift. Total Blocking Time measures how long the browser is blocked while loading and is an indicator of later responsiveness problems. Lighthouse can’t measure INP itself in this mode, because nobody clicks during the simulation.
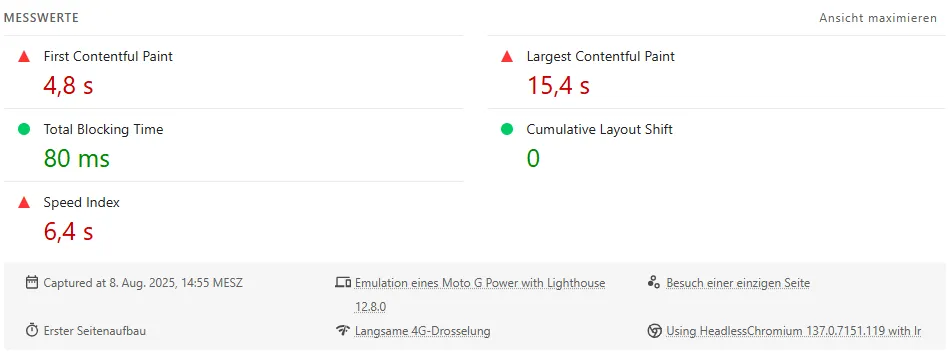
Lab data from Lighthouse: a single simulated measurement, here with an LCP of 15.4 s, while the field data for the same page shows 1.6 s (German interface).
Why lab and field can differ so much
The example above shows it clearly: in the lab the LCP takes over 15 seconds, for real visitors 1.6 seconds. The reasons are typical. The simulation deliberately uses a slow device and a slow connection; real visitors often have faster ones. Real visitors frequently return and already have files in their cache. And the simulation loads the page exactly once, so the result fluctuates from measurement to measurement.
This leads to the most important rule: field data counts for assessment, lab data for troubleshooting. The lab shows which files, images and scripts slow things down. Whether an improvement has an effect on real customers is shown by the field data after a few weeks.
Is the score a ranking factor?
No. The Lighthouse score isn’t a ranking signal for Google. Google assesses user experience using the field data of the Core Web Vitals, and even these are only one of many factors. With comparably good content they can tip the balance; they don’t make a weak page strong. How Google assesses pages overall is described in the entry on Google SEO.
For stores, revenue matters more than ranking anyway: slow pages and jumping layouts cost purchases long before they cost positions. More on this under conversion rate.
The typical brakes in an online store
LCP, the large image: the hero or product image is too large, in an old format or loaded late. The first large image should load immediately and with high priority; all others can wait. Modern formats such as WebP or AVIF save a lot of data; more on this under Google Images.
CLS, jumping content: images without defined dimensions, late-loading review widgets, notice bars and cookie banners that shift content, and fonts that switch while loading.
INP and Total Blocking Time, too much JavaScript: tracking, chat, reviews, recommendations and testing tools all run in the customer’s browser. The click on “Accept all” in the consent banner often starts them all at once. Server-side tracking provides significant relief here; more on this under server-side tracking.
TTFB, slow server: missing caching, overloaded hosting or complex calculations on every page view.
PageSpeed in Shopware and Shopify
In Shopware 6, a properly configured HTTP cache, fast hosting, a lean selection of plugins and a well-built theme are the most important levers. The cache mainly improves TTFB and LCP; it changes little about INP.
In Shopify, the platform handles hosting and delivery via a global network. Most problems arise from apps that bring their own JavaScript and from leftovers of uninstalled apps in the theme. Shopify also shows the Core Web Vitals of real visitors in the web performance report in the admin.
More on the peculiarities of the systems under Shopware SEO and Shopify SEO.
How to use PageSpeed Insights correctly
Test page types, not just the homepage: one typical category page and one product page, because that is where customers buy.
Mobile first: the mobile values are almost always the critical ones, and Google generally assesses pages in their mobile form; more on this under mobile SEO.
Measure several times: lab values fluctuate. Only several measurements give a reliable picture.
Field data as the goal: success means passed Core Web Vitals for real visitors, not a green 100 in the lab.
Search Console for the whole website: the Core Web Vitals report shows which groups of pages have problems.
Frequently asked questions
Does my store have to reach 100 points?
No. The score is an aid for troubleshooting. What matters are passed Core Web Vitals in the field data. Many successful stores score 50 to 80 points in the lab.
Why does the score change with every measurement?
Because the lab measurement depends on server, network and load at the moment of measurement. Fluctuations of several points are normal.
Why doesn’t PageSpeed Insights show any field data?
Because the page has too few visits from Chrome. The values for the whole domain or your own measurements of real visits help then.
How quickly will I see improvements?
In the lab immediately, in the field data after up to 28 days, because it rolls over four weeks.
Is a headless store automatically faster?
Not automatically. It can load very quickly but perform worse on responsiveness because of a lot of JavaScript. More on this in the article on headless with Shopware and Shopify.
Support with analysing and optimising loading time is available from arboro’s store support.